The National STR Map: Every Short-Term Rental Market, Rule and Number on One Screen
We put the rules, the revenue, the home prices, the risk and the reasons people visit on one map of the United States. Here is what is in it, where the numbers come from, and how to use it to shortlist a market.
The National STR Map at stragenthub.com/str-map covers 176 short-term rental markets in all 50 states and DC. Every market has a sourced regulation guide, and the map switches between 16 overlays, from revenue and gross yield to FEMA hazard risk and demand drivers. Type a budget into the Budget Finder and it shows the markets that fit. Where a figure has not been verified, the map leaves it blank instead of guessing.
Why We Built a National Map
Most short-term rental research starts in the wrong place. An investor hears that a city is hot, pulls a revenue figure, and only later discovers the permit cap, the owner-occupancy rule or the insurance bill. The order should be the other way round: can you legally operate, what does a suitable home cost, what does it earn, and what could go wrong.
Those answers usually live in four or five different places. The Interactive STR Map puts them on one screen, so you can compare Destin with Breckenridge with the Smokies in a minute, then open any market for the detail behind the colour.
The rule we built it on: nothing on the map is modelled or estimated by us. Every figure traces back to a market page, a regulation page or a public dataset. If we have not verified a number, the map leaves it out.
What Is on the Map
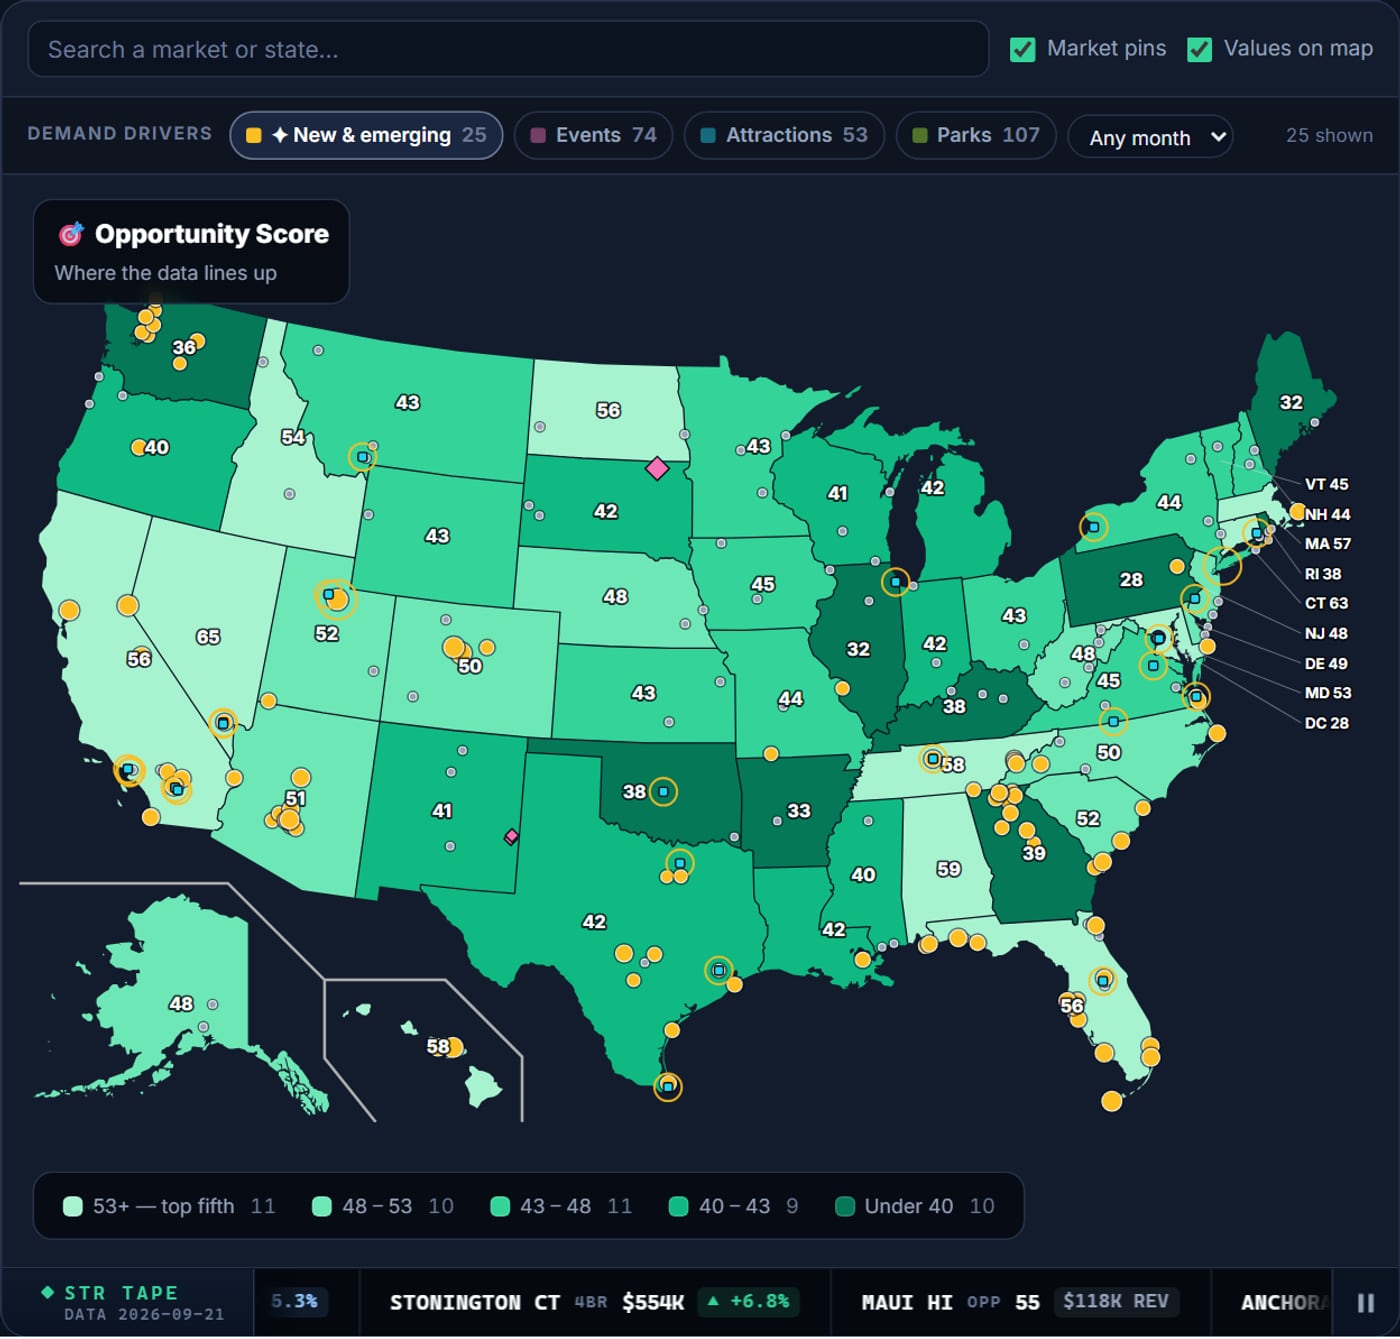
Each state is coloured by the overlay you choose, with the value printed on the state itself. Each dot is a tracked market. Click a state for its statewide picture and its markets ranked; click a market for its rules, numbers, risk and nearby demand drivers.
- Returns: Opportunity Score, annual revenue, nightly rate, occupancy and gross yield (annual revenue divided by the typical value of a 4-bedroom home).
- Rules: a 1-to-5 strictness rating for every market, with the permit, cap, occupancy limit, minimum stay, owner-occupancy rule, taxes and penalties where the ordinance states them.
- Demand: Demand Drivers (events, attractions, parks) and Drive-To Demand, the number of people living within 150 and 300 miles.
- Risk: the FEMA National Risk Index for the county, with the top hazards named, because insurance is now a line item that can sink a deal.
- Market context: vacation-home density, 4-bedroom home price, the share of homes with four or more bedrooms, tourism job share and an amenities score.
- Network: where STR Agent HUB has a specialist agent today, and how deep our research is in each state.
The rankings sit inside the map rather than in a table underneath it. Pick a ranking, such as highest gross yield, friendliest rules or lowest hazard risk, and the list and the map move together.
Start With Your Budget, Not With a City
The Budget Finder is the fastest way in. Enter a total purchase budget, or the cash you have to invest and a down-payment percentage, and it works out what that buys and highlights the markets where a typical 4-bedroom home fits. We use 4-bedroom values on purpose: larger homes that sleep a group are the part of the market most STR investors are actually shopping.
From there you can tighten the screen: only markets with moderate rules or lighter, a minimum gross yield, a minimum Opportunity Score, or a single region. The map dims everything that does not pass, and the count tells you how many of the 176 markets are left.
A two-minute shortlist
Set your budget, cap the regulation filter at Moderate, then sort the survivors by gross yield. Open the top five and read the rules for each. That is a defensible shortlist before you have called a single agent.
Regulations: One Table, One Source Per Row
Short-term rental law is local and it changes constantly. Every one of the 176 markets has a regulation guide on this site, and every rule shown on the map comes from a single regulations table with a source link and a last-verified date on each row. When a city changes its ordinance we update one row, and the map, the market panel and the regulation page all change with it.
The strictness rating runs from 1 (relaxed) to 5 (very strict). It rates what the current law says about caps, zoning limits, owner-occupancy and permits. It does not rate pending bills, and it does not rate HOA rules, which sit on top of city law and have to be checked property by property.
A rating is a starting point
Always confirm current requirements with the local jurisdiction and a licensed local agent before you buy. A strict rating does not make a market uninvestable, and a relaxed one does not mean every address qualifies.
Demand Drivers: The Reasons People Book
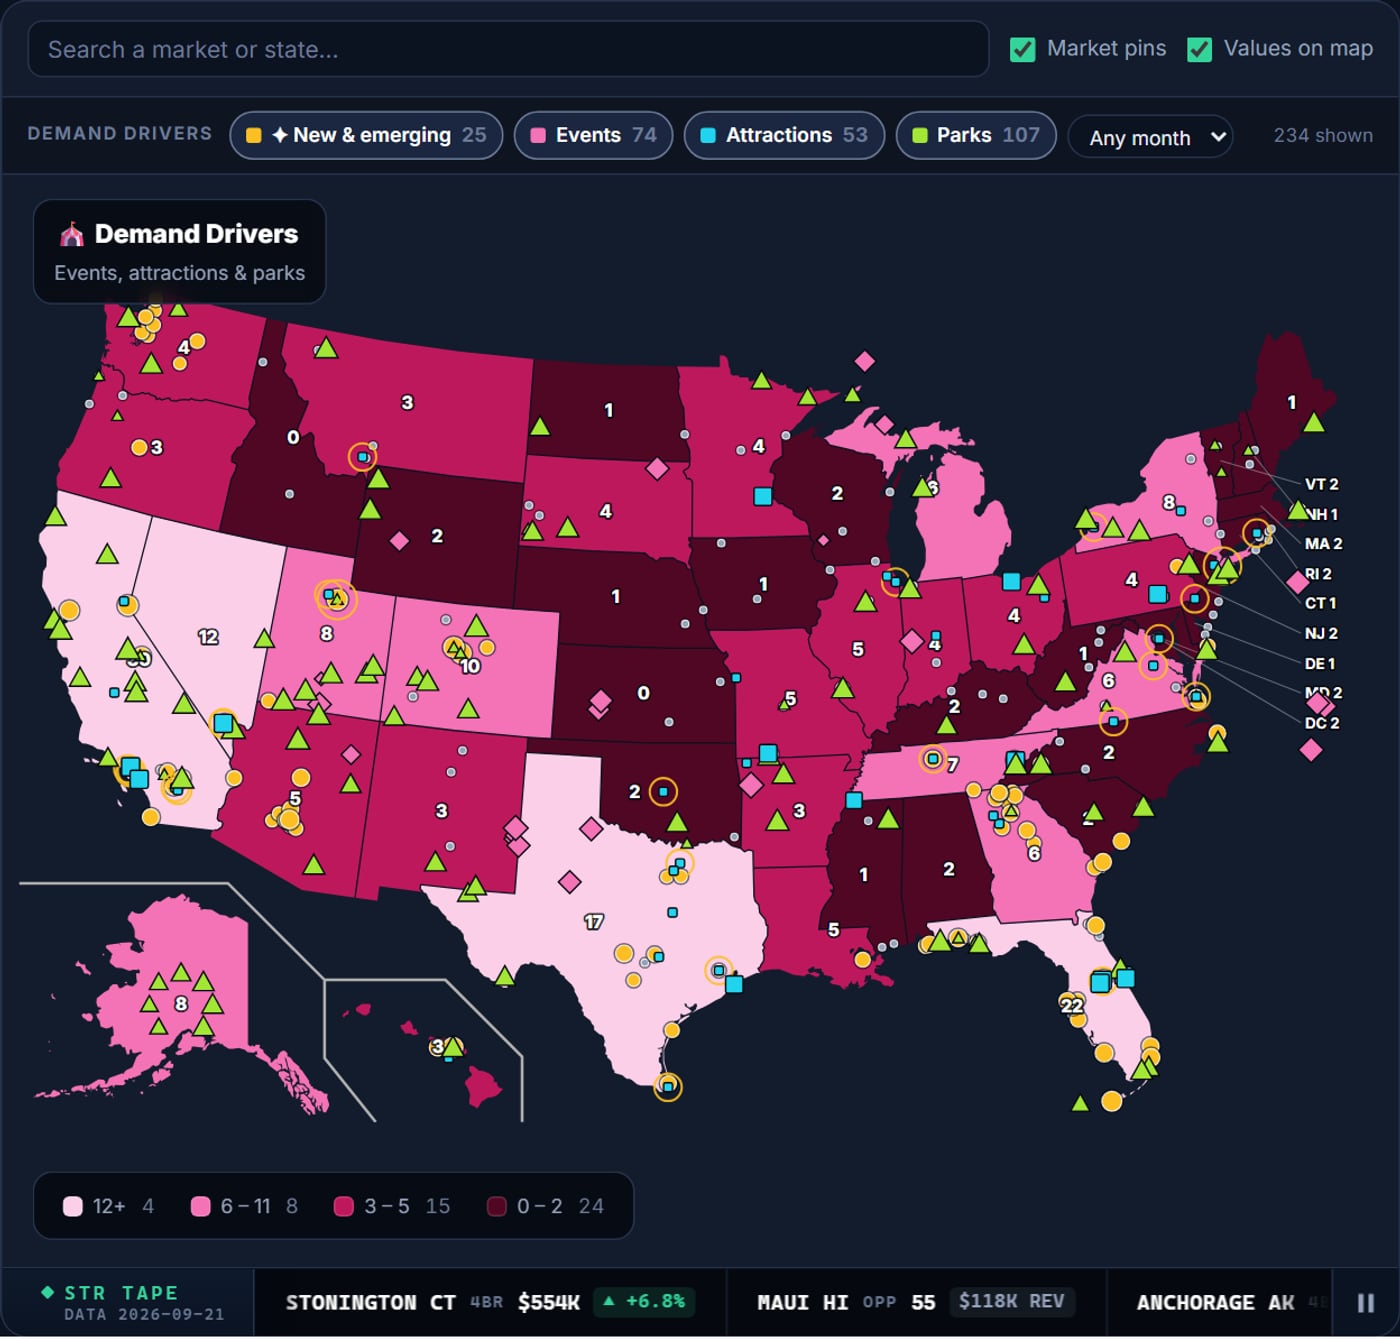
Annual averages hide the thing that often decides a deal: a festival that fills two spring weekends, a national park with millions of visits, a race weekend, or a theme park that did not exist two years ago. The Demand Drivers layer plots more than 230 of them at launch: recurring events, destination attractions, and parks and outdoor destinations, with attendance shown only where someone has published it.
National park figures are the National Park Service's own recreation visits for calendar year 2025. Great Smoky Mountains recorded 11.5 million; Zion, Yellowstone, Grand Canyon and Yosemite each recorded more than 4 million.
The part investors ask about most is New & emerging: 25 drivers that are new, under construction or announced. They include Universal's Epic Universe in Orlando and Universal Kids Resort in Frisco, Texas, surf parks in the Coachella Valley and Virginia Beach, and stadium projects in Nashville, Buffalo and Las Vegas. Stalled projects are marked as stalled, because an announcement is not an opening.
Open any driver to see the tracked markets within 50 miles. Filter by month to see what is happening in, say, October.
How the Opportunity Score Works
The Opportunity Score is a 0-to-100 summary of how the data lines up. It is a weighted blend, and the weights are published:
- 35% annual revenue, as a percentile among tracked markets
- 25% regulation, where lighter rules score higher
- 15% tourism intensity (share of local jobs in hospitality and recreation)
- 15% amenities within reach
- 10% share of homes with four or more bedrooms
Where a market has no verified revenue yet, the score assumes a below-median revenue position and is labelled partial, so an unknown cannot coast to the top on missing data. On full data, the top five at launch are Destin (82), Scottsdale (77), Breckenridge (75), Park City (74) and Vail (71).
What the score is not
It is not a forecast and not a promise of income. It ranks markets against each other on public data. Your property, your financing and your management decide your return.
Where the Numbers Come From
- Housing stock, bedrooms, vacation-home share, tourism jobs: U.S. Census Bureau, American Community Survey 5-year estimates, 2018-2022, for all 3,142 counties.
- Home values and year-over-year change: Zillow Home Value Index. Data provided by Zillow Group.
- Hazard risk: FEMA National Risk Index, by county.
- Amenities: OpenStreetMap contributors.
- Park visitation: National Park Service Visitor Use Statistics, 2025.
- Revenue, nightly rate, occupancy and regulations: STR Agent HUB market and regulation research, each page citing its sources.
Drive-to demand uses straight-line distance to county population centres, not road time, so treat it as a proxy. County figures describe the county, not a single neighbourhood.
Five Ways to Use It This Week
- Screen by budget with the Budget Finder, then cap regulation strictness at the level you are comfortable with.
- Check the downside by switching to Natural-Hazard Risk before you fall for a coastal market, and price insurance early.
- Look for what is coming with the New & emerging filter, and read the status notes: under construction is not the same as open.
- Compare side by side by pinning up to four markets to the compare tray, then run the deal calculator on the one you like.
- Print a market brief from any market panel and take it to your agent or lender.
If you prefer a list to a map, the same data is published as national rankings and state pages, including the best STR markets, highest gross yield and the most STR-friendly cities.
Frequently Asked Questions
How many markets does the National STR Map cover?
176 short-term rental markets across all 50 states and Washington, DC. Every one has a regulation guide, and 88 currently have fully verified revenue, nightly rate and occupancy data.
Are the revenue numbers estimates?
No. Revenue, nightly rate and occupancy are shown only where they come from our published market research. Where a figure has not been verified, the map leaves it blank rather than estimating it.
How is the regulation strictness rating decided?
Each market is rated 1 (relaxed) to 5 (very strict) from what its current ordinance says about permits, caps, zoning limits and owner-occupancy. Pending legislation and HOA rules are not part of the rating. Each row cites its source and the date it was last verified.
What is the Opportunity Score?
A 0-to-100 blend of annual revenue (35%), regulation (25%), tourism intensity (15%), amenities (15%) and the share of homes with four or more bedrooms (10%). It ranks markets against each other on public data and is not a forecast of income.
What are demand drivers?
The events, attractions and parks that bring overnight visitors: festivals, race weekends, theme parks, surf parks, stadiums and national parks. The map plots them and shows which tracked markets sit within 50 miles of each.
How often is the map updated?
The regulations table is updated whenever a rule change is verified, and the public datasets are refreshed when their publishers release new data. The map shows the date of the dataset it is displaying.
Does a low strictness rating mean I can rent any property?
No. Zoning, HOA covenants and building rules can still prohibit short-term rentals at a specific address. Confirm with the local jurisdiction and a licensed local agent before you buy.
See Your Budget on the National STR Map
Open the map, type in your budget and see which markets fit. When you have a shortlist, we will match you with an STR-specialist agent who works that market.
Open the National STR Map